Inclusion & Diversity Initiatives
Building climate resilience that reaches every community, respects every culture, and empowers every voice in Minneapolis.
Our Outreach Strategies
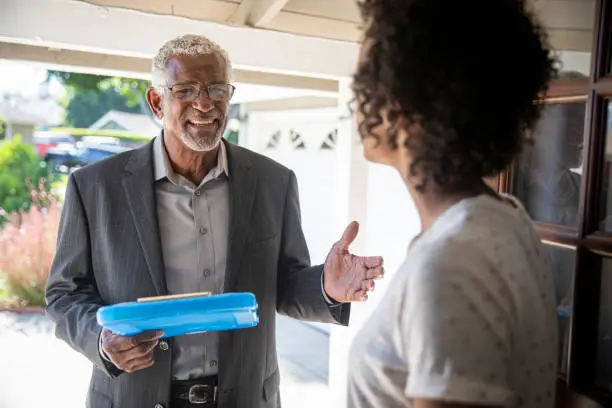
Door-to-Door Community Engagement
Our trained volunteers visit neighborhoods to build personal connections and share resources.
Community Voices
"The training materials in Spanish made all the difference for my family. Now my elderly parents know exactly what to do during severe weather."
Maria Gonzalez
Community Volunteer • Phillips
Community Participation Dashboard
Tracking our progress toward equitable participation across Minneapolis neighborhoods.
| Community | Population | Residents Trained | Participation Rate | Coordinators |
|---|---|---|---|---|
| Phillips | 12,500 | 2,800 | 22.4% | 8 |
| Cedar-Riverside | 8,900 | 2,100 | 23.6% | 6 |
| Frogtown | 15,200 | 3,200 | 21.1% | 10 |
| Northeast | 18,700 | 4,100 | 21.9% | 12 |
| North Loop | 9,800 | 1,800 | 18.4% | 5 |
| Powderhorn | 11,300 | 2,600 | 23% | 7 |
| Seward | 13,600 | 2,900 | 21.3% | 9 |
| Whittier | 10,400 | 2,200 | 21.2% | 6 |
22,800 total residents trained
21.7% average participation rate
63 community coordinators